First time getting started with Fenics (and using a finite element analysis package in general), could I have some advice or help on a problem I'm working on?

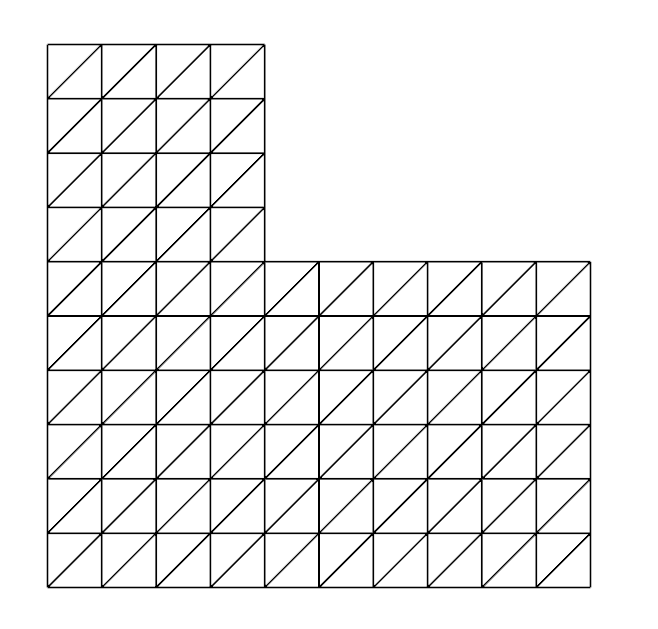
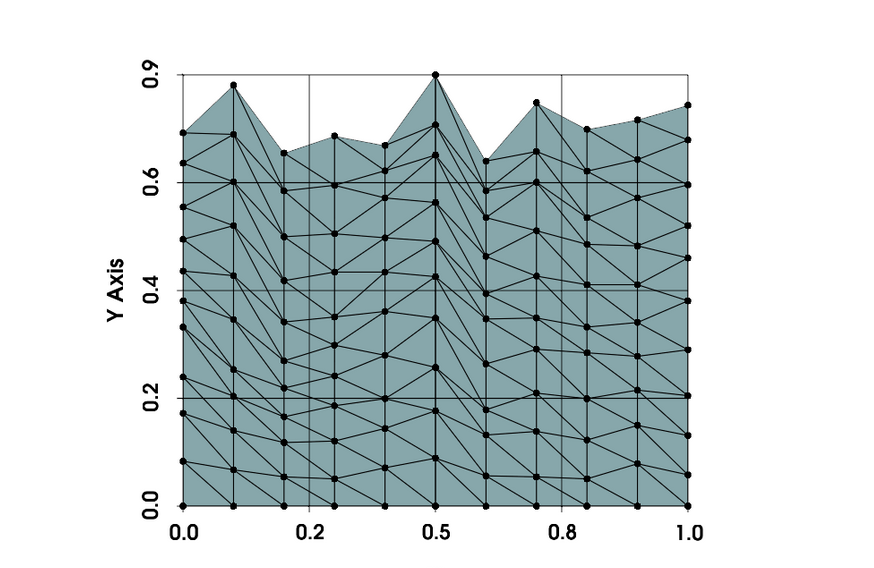
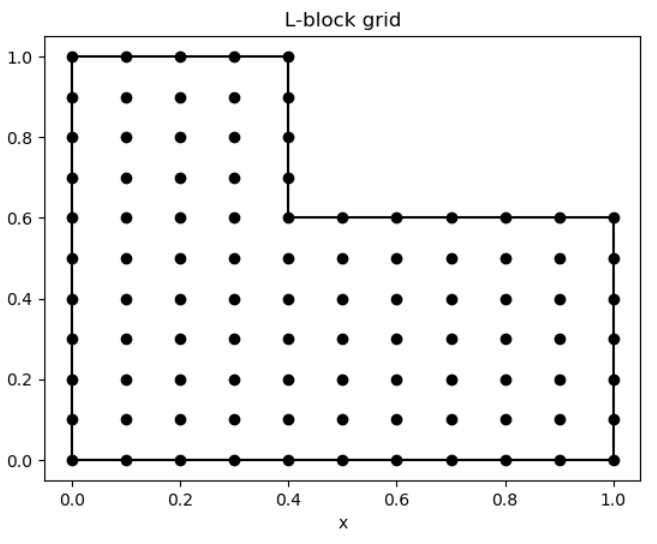
I have the following L-shaped block with equally spaced grid points that I want to solve Laplace’s Equation w/ a Dirichlet Boundary Condition over:

Initially, I wrote up a Jacobi iteration solver to solve the Euler Backward discretized partial difference equation to see what the solution should converge to as a reference, and now I’m ready to dive into using fenics for the first time to discretize and solve the problem. I looked over one example for the heat equation, and from the standpoint of a beginner, it looks like I need to start by connecting the gridpoints into geometric shapes called a “mesh”, then apply an initial condition, then boundary conditions, then forcing term (0 in this case), and use a solver. What I need the most help with, is how to create a mesh from my set of gridpoints.

num_of_points_x, num_of_points_y = 11, 11 
N, M = num_of_points_x-1, num_of_points_y-1
dx, dy = 0.1, 0.1 
j, l = np.arange(0,num_of_points_x), np.arange(0,num_of_points_y) 
x, y = j*dx, l*dy
[DNE_block_x,DNE_block_y] = np.meshgrid(np.arange(N+1-4,N+1),np.arange(N+1-6,N+1));
[X,Y] = np.meshgrid(x,y)
X[DNE_block_x,DNE_block_y] = np.nan
Y[DNE_block_x,DNE_block_y] = np.nan

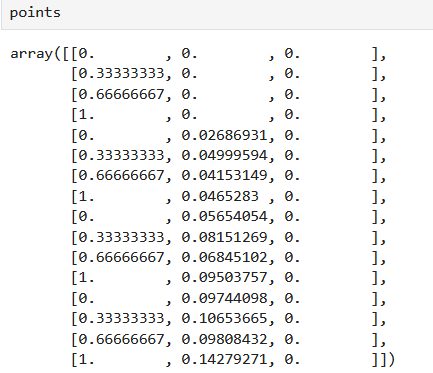
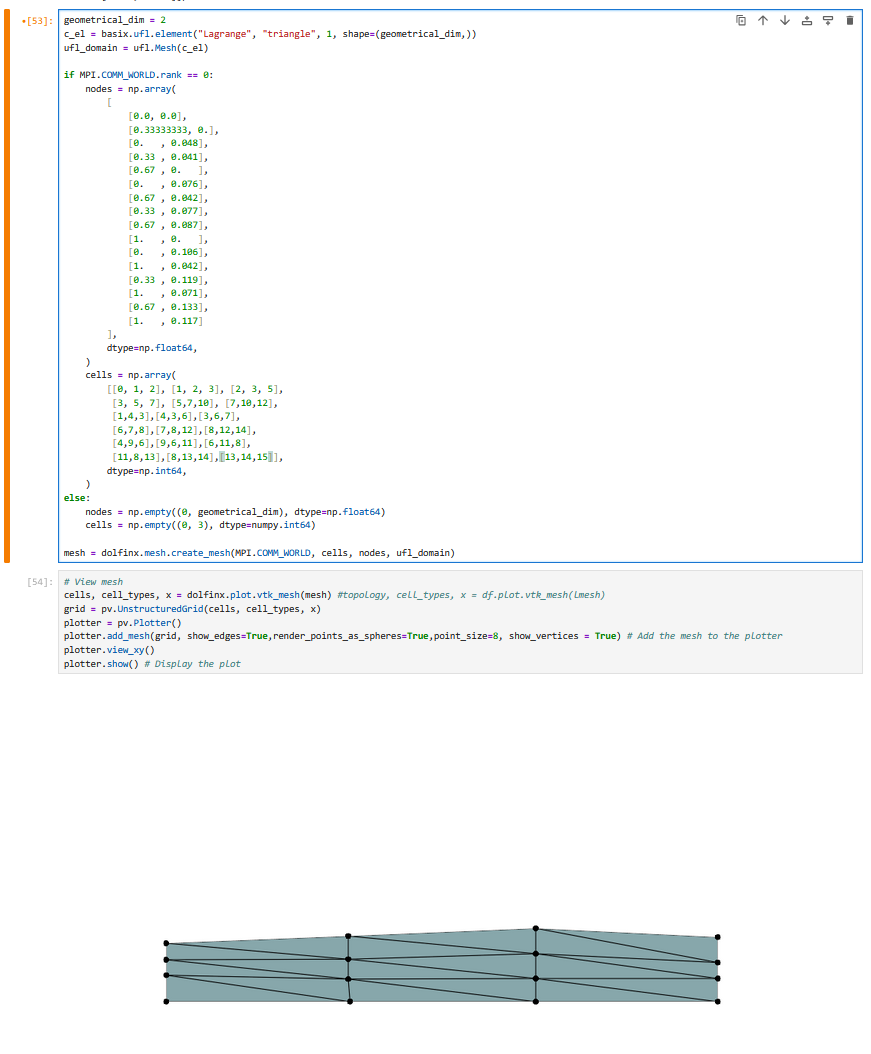
I have my 2 2-D numpy arrays, X and Y, with NaN values outside of the L-shaped block’s boundaries, and I know that dolfinx has some built-in mesh generating functions, but I know that they don’t simply accept N-Dimensional numpy arrays and spit out a mesh, so that’s where I need help i.e. figuring out how to create a mesh for my L-shaped grid. More specifically, it states in the documentation of dolfinx.mesh.create_mesh() that it “Create a mesh from topology and geometry arrays”, I don’t know what topology or geometry arrays are, what they look like, or how to create them, but I’m guessing they can be made from my X and Y arrays, and I would like to know how (if possible), as well as what goes where for the parameters i.e. what goes in place of parameters “cells”, “x”, and “e”.

This doesn’t really answer your question, but here’s a quick trick for creating an Lshape:

import dolfinx
from mpi4py import MPI
import numpy as np

bounds = [[0.0, 0.0], [1.0, 1.0]]  # Original bounds of rectangle
xcutoff, ycutoff = 0.4, 0.6  # Cutoff to make L-shape

mesh = dolfinx.mesh.create_rectangle(MPI.COMM_WORLD, bounds, [10, 10])

tdim = mesh.topology.dim
im_tdim = mesh.topology.index_map(tdim)
cells = np.arange(im_tdim.size_local + im_tdim.num_ghosts, dtype=np.int32)
midpoints = dolfinx.mesh.compute_midpoints(mesh, tdim, cells)
cells_to_remove = (midpoints[:, 0] >= xcutoff) & (midpoints[:, 1] >= ycutoff)
cells_to_keep = np.where(~cells_to_remove)[0]
lmesh, _, _, _ = dolfinx.mesh.create_submesh(mesh, mesh.topology.dim, cells_to_keep)

Note that for load-balancing purposes it may be worth saving this to file and loading it back in (so each processor has roughly equivalent work to do).

1 Like

I think that’s a good start to help show me some tricks and gain further insight into the moving parts under the hood when creating a mesh like midpoints, cells, etc. I’m still very new to all of this.

How would you handle something much more unorthodox like the following below

num_of_points = 11; N = num_of_points-1; dx,dy = 0.1,0.1 
j,l = np.arange(0,N+1),np.arange(0,N+1); x = j*dx;y = l*dy;
[X,Y] = np.meshgrid(x,y)

Y = np.zeros((N+1,N+1));
# Generates uneven vertical separation between points
for n in range(0,N+1):
    dy = np.random.uniform(0.025,.05,size = N+1)  #Randomly generated Δy
    Y[:,n] = np.cumsum(l*dy)

Y[1:-1,:] = Y[1:-1,:]+.2
Dy = np.diff(Y,axis = 0)

fig1 = plt.figure(1,figsize=(16,9))
ax = fig1.add_subplot()
for j in range(0,N+1):        
    ax.plot(x,Y[j,:],linewidth = 2,color = 'k',marker = 'o', markersize = 9, linestyle = '--')
            
plt.title("Unevenly layered fluid")
ax.plot(x,Y[-1,:],linewidth = 4,color = 'k')  #Top border
ax.plot(np.zeros(11),Y[:,0], linewidth = 4, color = 'k') #Left border
ax.plot(np.ones(11),Y[:,-1], linewidth = 4, color = 'k') #Right border
ax.plot(x,Y[0,:],linewidth = 4,color = 'k') #Bottom border
ax.set_xlabel(r'$x$')
ax.set_ylabel(r'$z$')
plt.ylim((0,2.5))
plt.grid()
plt.show()


where the dashed lines are each of the unevenly spaced layers, and the solid lines are the boundaries. We can see that the horizontal spacing is even, but the vertical spacing varies from point-to-point. In a scenario like this, I think we would have to take the x and y data to create a custom grid, but maybe you have a workaround in mind for this as well?

See for instance: I need to create stuctured uniform, structuted non-uniform, and unstructured mesh in 2D - #5 by dokken which shows you how to define a uniform structured grid to get a similar structure to what you want.

2 Likes

Thank you! I have taken a look at what you have provided, and the code works on my end. I’m guessing my grid type is “structured non-uniform”, and my prior example was a portion of a “structured uniform” grid. The vertex_to_dof_map_vectorized and perturb_mesh certainly look more advanced than what I’m capable of understanding at the moment, but thankfully it looks like the only thing I need to mess around with are the user-defined expressions to see if I can’t implement a way to randomly generate y-deltas like you probably saw in my code.

I’ll try to see if I can’t use this to suit my needs, and make a follow up post if and when I get the desired result.

Another alternative is to generate the grid by hand, as sketched out in:

This looks more in line with what I was looking for. I touched up my code a little as I noticed some mistakes

num_of_points = 4; N = num_of_points-1; dx,dy = 1/N,1/N 
j,l = np.arange(0,N+1),np.arange(0,N+1); x = j*dx;y = l*dy;

[X,Y] = np.meshgrid(x,y)

Y = np.zeros((N+1,N+1));
for n in range(1,N+1):
    dy = np.random.uniform(0.025,.05,size = N+1)
    Y[n,:] = Y[n-1,:] + dy

and added this line at the end
points = np.array([X.ravel(),Y.ravel(),np.zeros((N+1)*(N+1))]).transpose().

I used the ravel function to create a list of 3D coordinates with columns corresponding to x, y, and z. Does what I have below look like it will work

or do the points need to be in a specific order like I see them in nodes? The same question also applies for the order of the points which make up the grid cells. I thought I had the pattern down for creating the triangular cells until I got to the last cell where I expected [6,3,7], but it was [6,7,3].

The nodes do not have to be in a specific order.

1 Like

Looks like it worked. Now I just need to find a way to the creation of cells done for me and that will be the final step for creating a mesh, and then I can move on to latter steps of solving a PDE on the mesh. There’s probably a function in dolfinx or a python package out there somewhere that connects the points into cells such that they form some specified desired shape (in 2D, I think we want triangles, and in 3D, tetrahedrons).

I made a nested for loop to make grid cells out of the points as a band-aid solution for creating 2D rectangular meshes of varying sizes without manually inputting each point and creating each cell by hand.

num_of_points = 11; N = num_of_points-1; dx,dy = 1/N,1/N 
j,l = np.arange(0,N+1),np.arange(0,N+1); x = j*dx;y = l*dy;
k = 1
dt = np.round(1/4 * dx**2 * 1/k,4); 
t = .01*20/4
m = int(t/dt)
[X,Y] = np.meshgrid(x,y)

Y = np.zeros((N+1,N+1));
for n in range(1,N+1):
    dy = np.random.uniform(0.05,.1,size = N+1)
    Y[n,:] = Y[n-1,:] + dy

# Dokken's code #
geometrical_dim = 2
c_el = basix.ufl.element("Lagrange", "triangle", 1, shape=(geometrical_dim,))
ufl_domain = ufl.Mesh(c_el)
#################

# new code
points = np.array([np.round(X,2).ravel(),np.round(Y,3).ravel()]).transpose()
cells = []
row = 0 # row counter
for rows in X: #list comprehension style for loop
    i=0
    if row <=len(rows)-2: # if current row is before last row
        for x in rows: # iterate along columns in row
            if i <= len(rows)-2: # if column position, i, in row is before last point in row 
                j = row*len(rows)+i # j-th point on grid
                # j+len(rows) gives point in the next row
                cells.extend([[j,j+1,j+len(rows)]]) 
                cells.extend([[j+1,j+len(rows),j+len(rows)+1]])
            i+=1 
    row+=1 # increment row

cells = np.array(cells)

# Dokken's code #
mesh = dolfinx.mesh.create_mesh(MPI.COMM_WORLD, cells, points, ufl_domain)
#################

# View mesh
cells, cell_types, x = dolfinx.plot.vtk_mesh(mesh) #topology, cell_types, x = df.plot.vtk_mesh(lmesh)
grid = pv.UnstructuredGrid(cells, cell_types, x)
plotter = pv.Plotter()
plotter.add_mesh(grid, show_edges=True,render_points_as_spheres=True,point_size=8, show_vertices = True) # Add the mesh to the plotter
plotter.view_xy()
plotter.show_grid()
plotter.show() # Display the plot

There are probably more elegant ways of writing the code to increase efficiency in cases where there are, for example 10^8 points, but this will work for now. Ideally I would want a package with tools or an existing tool in dolfinx to handle this for me for different dimensions and geometries. Do you know of any?

There are many meshing tools out there, such as gmsh, ftetwild, netgen that come with a Python interface.

Your use-case seems quite special, and I haven’t seen this specific kind of mesh generated with either.

Please note that since DOLFINx only requires the array data structures, you are free to use any tool to create such meshes.

Of those you mentioned, I actually have tried GMSH and used its GUI to make a 2D grid, the issue was that when I exported the mesh file as a .mesh file, something weird would happen to the original mesh’s edges that I don’t know how to explain. I’ll try to give the others a try.

And to your comment on my use case, this was just a test grid to see how custom points were handled in mesh creation in fenics. What I created was meant to look similar to the r-theta plane of a subregion of the full grid that I’m using for my original problem. The original file I’m using contains meteorological data, and in meteorology, data is gridded in spherical coordinates (the Earth), except with pressure being the vertical coordinate instead of r, however r-coordinate data is also provided for each data if it’s needed. If you go back and take another look at the second plot I posted, each one of those dashed lines is analogous to a layer of constant pressure from the ground to the tropopause, and you can see that the heights of each layer varies vertically in a sort of wavy fashion which is pretty close to how it typically looks in real life.

The actual problem that I intended to work on once I figured out grid creation, was to use a subregion of one of the pressure layers on the phi-theta plane (which would look something like the following below)

to solve Poisson’s Equation on. Is Fenics able to solve PDEs on a mesh like this?

As long as the mesh doesn’t contain any degenerate cells, I do not see a reason why FEniCS wouldn’t be able to solve the PDE.

As mentioned above, one can read in any mesh (as long as it conforms to the array format described in Mesh generation — FEniCS Workshop)

We also support reading in specific mesh formats: xdmf, msh and vtkhdf.

Meshio is also a mesh conversion tool that can be used to transfer meshes between formats.

1 Like