Hello, I have two questions
How is the mesh made with Fenics ? If for example I take a sheet of paper and I draw a square, how will he proceed to create the mesh with horizontal and/or vertical lines? (like in Eshelby problem)
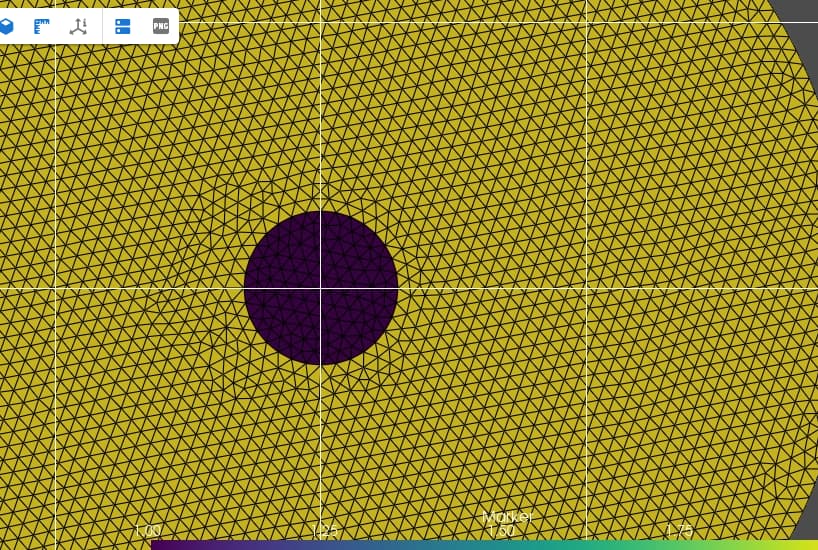
I want to plot the mesh with a color code to locate the inclusion and the matrix in the Eshelby Problem. With the code below I get the image that I show again below. But the inclusion is not colored.
from dolfinx.plot import create_vtk_mesh
pyvista.set_jupyter_backend("none")
grid = pyvista.UnstructuredGrid(*create_vtk_mesh(domain))
plotter = pyvista.Plotter()
plotter.add_mesh(grid, show_edges=True)
plotter.show_bounds(grid='front', location='outer', all_edges=True)
plotter.view_xy()
plotter.show()
What I want to achieve is something like this:
I don’t get this result.
Thank you for your help.
The source code for mesh generation is here:
              const std::int64_t v3 = v1 + (nx + 1);
              const std::int64_t v4 = v0 + (nx + 1) * (ny + 1);
              const std::int64_t v5 = v1 + (nx + 1) * (ny + 1);
              const std::int64_t v6 = v2 + (nx + 1) * (ny + 1);
              const std::int64_t v7 = v3 + (nx + 1) * (ny + 1);

              std::array<std::int64_t, 6> c0 = {v0, v1, v2, v4, v5, v6};
              std::array<std::int64_t, 6> c1 = {v1, v2, v3, v5, v6, v7};

              std::copy(c0.begin(), c0.end(),
                        std::next(cells.begin(), 6 * ((i - range_c[0]) * 2)));
              std::copy(c1.begin(), c1.end(),
                        std::next(cells.begin(), 6 * ((i - range_c[0]) * 2 + 1)));
            }

            fem::CoordinateElement<T> element(CellType::prism, 1);
            return create_mesh(comm, graph::regular_adjacency_list(std::move(cells), 6),
                               {element}, geom, {geom.size() / 3, 3}, partitioner);
          }

          template <std::floating_point T>
The code you have supplied is not complete, in the sense that one cannot reproduce the plots, as you haven’t supplied the code that defines your domain variable.
Note that you can send in your vertex and cells in any order you would like, see: Mesh creation in serial and parallel — FEniCSx Documentation
Here is a complete code :
import dolfinx # FEM in python
import matplotlib.pyplot as plt
import ufl # variational formulations
import numpy as np
from mpi4py import MPI
from petsc4py.PETSc import ScalarType
import gmsh # Mesh generation
import pyvista
import extract

# Geometry
R_i = 1.0 # Radius of the inclusion
R_e = 6.9  # Radius of the matrix (whole domain)
aspect_ratio = 1.0 # start with a circle, otherwise ellipse

# Material
E_m = 0.8 # Young's modulus in matrix
nu_m = 0.35 # Poisson's ratio in matrix
E_i = 11.0 # Young's modulus of inclusion
nu_i = 0.3 # Poisson's ratio in inclusion

#CREATE THE MESH WITH GMSH

mesh_size = R_i/5
mesh_order = 1

mesh_comm = MPI.COMM_WORLD
model_rank = 0
gmsh.initialize()
facet_names = {"inner_boundary": 1, "outer_boundary": 2}
cell_names = {"inclusion": 1, "matrix": 2}
model = gmsh.model()
model.add("Disk")
model.setCurrent("Disk")
gdim = 2 # geometric dimension of the mesh
inner_disk = gmsh.model.occ.addDisk(0, 0, 0, R_i, aspect_ratio * R_i)
outer_disk = gmsh.model.occ.addDisk(0, 0, 0, R_e, R_e)
whole_domain = gmsh.model.occ.fragment([(gdim, outer_disk)], [(gdim, inner_disk)])
gmsh.model.occ.synchronize()

# Add physical tag for bulk
inner_domain = whole_domain[0][0]
outer_domain = whole_domain[0][1]
model.addPhysicalGroup(gdim, [inner_domain[1]], tag=cell_names["inclusion"])
model.setPhysicalName(gdim, inner_domain[1], "Inclusion")
model.addPhysicalGroup(gdim, [outer_domain[1]], tag=cell_names["matrix"])
model.setPhysicalName(gdim, outer_domain[1], "Matrix")

# Add physical tag for boundaries
lines = gmsh.model.getEntities(dim=1)
inner_boundary = lines[1][1]
outer_boundary = lines[0][1]
gmsh.model.addPhysicalGroup(1, [inner_boundary], facet_names["inner_boundary"])
gmsh.model.addPhysicalGroup(1, [outer_boundary], facet_names["outer_boundary"])
gmsh.option.setNumber("Mesh.CharacteristicLengthMin",mesh_size)
gmsh.option.setNumber("Mesh.CharacteristicLengthMax",mesh_size)
model.mesh.generate(gdim)
gmsh.option.setNumber("General.Terminal", 1)
model.mesh.setOrder(mesh_order)
gmsh.option.setNumber("General.Terminal", 0)

# Import the mesh in dolfinx
from dolfinx.io import gmshio
domain, cell_tags, facet_tags = gmshio.model_to_mesh(model, mesh_comm, model_rank, gdim=gdim)
domain.name = "composite"
cell_tags.name = f"{domain.name}_cells"
facet_tags.name = f"{domain.name}_facets"
gmsh.finalize()

cell_names["matrix"]
cell_names["inclusion"]

from dolfinx.plot import create_vtk_mesh
pyvista.set_jupyter_backend("none")

grid = pyvista.UnstructuredGrid(*create_vtk_mesh(domain))
plotter = pyvista.Plotter()
plotter.add_mesh(grid, show_edges=True)
plotter.show_bounds(grid='front', location='outer', all_edges=True)
plotter.view_xy()
plotter.show()
I would strongly consider looking at the tutorials:https://jsdokken.com/dolfinx-tutorial/chapter3/em.html
As it shows how to plot the cell markers
from dolfinx.plot import create_vtk_mesh
pyvista.set_jupyter_backend("static")
pyvista.start_xvfb()
grid = pyvista.UnstructuredGrid(*create_vtk_mesh(domain))
plotter = pyvista.Plotter()
num_local_cells = domain.topology.index_map(domain.topology.dim).size_local
grid.cell_data["Marker"] = cell_tags.values[cell_tags.indices<num_local_cells]
grid.set_active_scalars("Marker")
plotter.add_mesh(grid, show_edges=True)
plotter.show_bounds(grid='front', location='outer', all_edges=True)
plotter.view_xy()
plotter.show()
yielding