I made a nested for loop to make grid cells out of the points as a band-aid solution for creating 2D rectangular meshes of varying sizes without manually inputting each point and creating each cell by hand.
num_of_points = 11; N = num_of_points-1; dx,dy = 1/N,1/N
j,l = np.arange(0,N+1),np.arange(0,N+1); x = j*dx;y = l*dy;
k = 1
dt = np.round(1/4 * dx**2 * 1/k,4);
t = .01*20/4
m = int(t/dt)
[X,Y] = np.meshgrid(x,y)
Y = np.zeros((N+1,N+1));
for n in range(1,N+1):
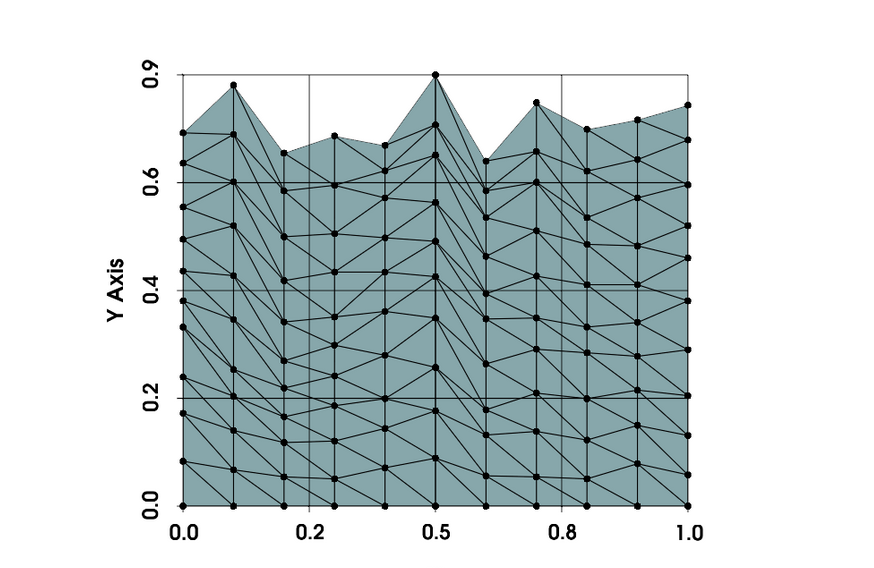
dy = np.random.uniform(0.05,.1,size = N+1)
Y[n,:] = Y[n-1,:] + dy
# Dokken's code #
geometrical_dim = 2
c_el = basix.ufl.element("Lagrange", "triangle", 1, shape=(geometrical_dim,))
ufl_domain = ufl.Mesh(c_el)
#################
# new code
points = np.array([np.round(X,2).ravel(),np.round(Y,3).ravel()]).transpose()
cells = []
row = 0 # row counter
for rows in X: #list comprehension style for loop
i=0
if row <=len(rows)-2: # if current row is before last row
for x in rows: # iterate along columns in row
if i <= len(rows)-2: # if column position, i, in row is before last point in row
j = row*len(rows)+i # j-th point on grid
# j+len(rows) gives point in the next row
cells.extend([[j,j+1,j+len(rows)]])
cells.extend([[j+1,j+len(rows),j+len(rows)+1]])
i+=1
row+=1 # increment row
cells = np.array(cells)
# Dokken's code #
mesh = dolfinx.mesh.create_mesh(MPI.COMM_WORLD, cells, points, ufl_domain)
#################
# View mesh
cells, cell_types, x = dolfinx.plot.vtk_mesh(mesh) #topology, cell_types, x = df.plot.vtk_mesh(lmesh)
grid = pv.UnstructuredGrid(cells, cell_types, x)
plotter = pv.Plotter()
plotter.add_mesh(grid, show_edges=True,render_points_as_spheres=True,point_size=8, show_vertices = True) # Add the mesh to the plotter
plotter.view_xy()
plotter.show_grid()
plotter.show() # Display the plot
There are probably more elegant ways of writing the code to increase efficiency in cases where there are, for example 10^8 points, but this will work for now. Ideally I would want a package with tools or an existing tool in dolfinx to handle this for me for different dimensions and geometries. Do you know of any?