Hi,
Based on the code given below, I have created a rectangular domain consisting of 3 materials which are randomly distributed. For this, I have used the material data from a input file ‘material.dat’. I am successfully able to create the subdomains. Here, I am able to define the domain (external) boundaries (which are the boundaries of the rectangle). However, I am not able to define the internal boundaries between any 2 materials. Can anyone please guide me on how to define these? I am attaching a photo of the domain here.
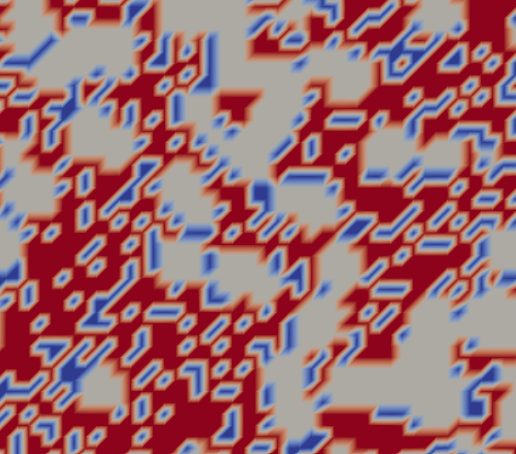
Thanks a lot in advance for the help.
from dolfin import *
import numpy as np
import matplotlib.pyplot as plt
from matplotlib import cm
import csv
from ufl import sinh

NX_points = 100
domain_length = 20e-6

# mesh = UnitSquareMesh(100, 100)
mesh = RectangleMesh(Point(0, 0), Point(domain_length, domain_length), int(NX_points), int(NX_points))
# plot(mesh)
# plt.show()

V0 = FunctionSpace(mesh, "DG", 0)
u = Function(V0)

dx = domain_length/100

material_array = list()

#---------------Import material file----------------#

with open ('material.dat','r') as f:
    csv_reader = csv.reader (f, delimiter = "\t")


    for line in csv_reader:
        x_temp = float(line[0])
        y_temp = float(line[1])
        z_temp = float(line[2])

        c_temp = int(line[3])

        material_array.append((c_temp))
        # material_array.append(c_temp)

material_array = np.array(material_array) # Material array
print(len(material_array))
#-------------------------------------------------------#

values = np.arange(100*100)

materials = MeshFunction('size_t', mesh, 2, mesh.domains())

# print(values)
local_values = np.zeros_like(u.vector().get_local())
local_values_material = np.zeros_like(u.vector().get_local())
for cell in cells(mesh):
    midpoint = cell.midpoint().array()
    i = int(midpoint[0] // dx)
    j = int(midpoint[1] // dx)
    pos = i + 100*j
    local_values[cell.index()] = values[pos]
    local_values_material[cell.index()] = material_array[pos]
    # materials[cell] = local_values_material[cell.index()]
    print(midpoint, i, j , pos)

# materials.array()[:] = local_values_material[cell.index()[:]]
materials.array()[:] = local_values_material

# u.vector().set_local(local_values)
u.vector().set_local(local_values_material)

File("u.pvd") << u

plot(materials)
p = plot(materials, vmin = 0, vmax = 2)
plt.colorbar(p)
plt.ticklabel_format(style='sci', axis='x', scilimits=(0,0))
plt.ticklabel_format(style='sci', axis='y', scilimits=(0,0))
# plt.savefig('material' + str(count_1) + str(count_2) + '.png')
plt.show()

#--------------------Boundaries-----------------------------------#

class LeftBoundary(SubDomain):
    def inside(self, x, on_boundary):
        return near(x[0], 0.) and on_boundary
Left = LeftBoundary()

class RightBoundary(SubDomain):
    def inside(self, x, on_boundary):
        return near(x[0], domain_length) and on_boundary
Right = RightBoundary()

class TopBoundary(SubDomain):
    def inside(self, x, on_boundary):
        return near(x[1], domain_length) and on_boundary
Top = TopBoundary()

class BottonBoundary(SubDomain):
    def inside(self, x, on_boundary):
        return near(x[1], 0.0) and on_boundary
Bottom = BottonBoundary()

dx = Measure("dx")[materials]

mesh_boundaries = MeshFunction('size_t', mesh, mesh.topology().dim() - 1)
mesh_boundaries.set_all(5) # 5 denotes top boundary

Left.mark(mesh_boundaries, 1)
Right.mark(mesh_boundaries, 2)
# Top.mark(mesh_boundaries, 3)
Bottom.mark(mesh_boundaries,4)

# ds = Measure("ds")[mesh_boundaries]
ds = Measure('ds',domain=mesh,subdomain_data=mesh_boundaries)