Dear all,
I am using Fenicsx to model a static problem of the Reissner-Mindlin unit square plate under unifrom load, with displacements fixed on each border.
I based my code on two very good tutorials:
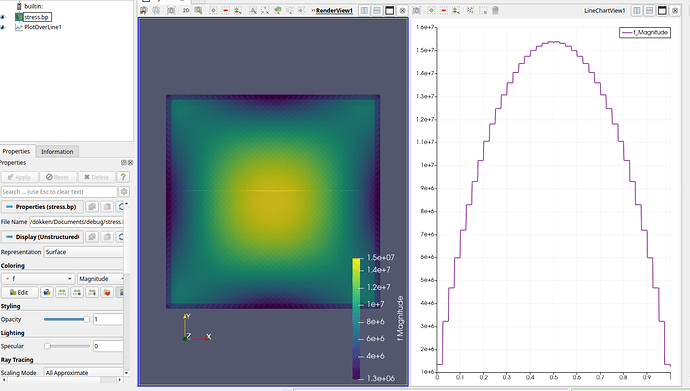
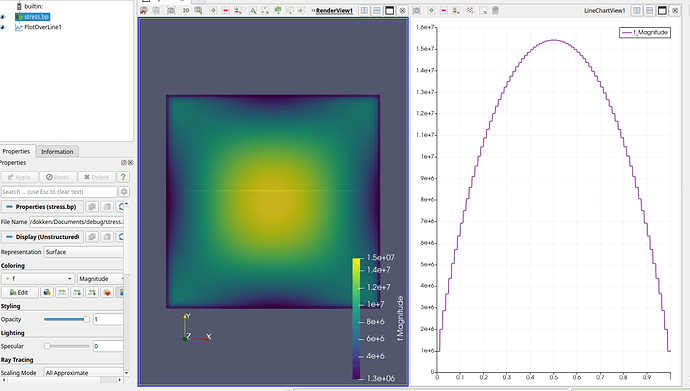
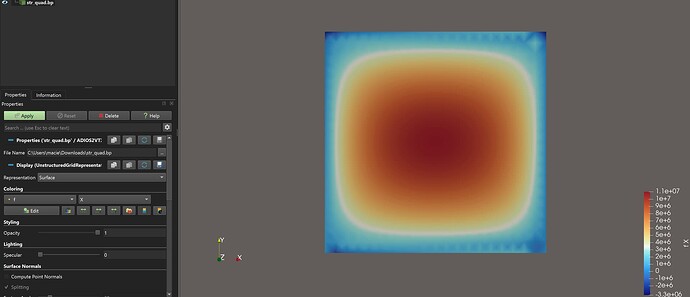
When I get the stress results (sigma_x), the results are correct; however, they are not smooth and symmetric (please see the figure below).
As you can see, the stress seems to be moved sligthly to left.
I do believe that I am misusing interpolate function, though, I do not know what to do to improve this figure/ these results.
I work with:
- python=3.11.10
- fenics-libdolfinx=0.9.0
- matplotlib=3.8.3
This is the code that I used to generate this figure:
import numpy as np
import ufl
import basix

from mpi4py import MPI
from dolfinx import fem

from dolfinx.fem.petsc import LinearProblem
from dolfinx.mesh import (
    CellType,
    DiagonalType,
    create_unit_square,
    locate_entities_boundary,
)

from matplotlib import pyplot, tri as tri_plot


"""
Based on:
https://bleyerj.github.io/comet-fenicsx/intro/plates/plates.html
https://jsdokken.com/dolfinx-tutorial/chapter2/linearelasticity_code.html
"""
# number of elements per edge
N = 20

domain = create_unit_square(
    MPI.COMM_WORLD, N, N, cell_type=CellType.triangle, diagonal=DiagonalType.crossed
)

# material parameters
E = 31.45e9
nu = 0.2
kappa = 5.0 / 6.0
thick = 0.05

# bending stiffness
D = fem.Constant(domain, E * thick**3 / (1 - nu**2) / 12.0)
# shear stiffness
F = fem.Constant(domain, E / 2 / (1 + nu) * thick * 5.0 / 6.0)

# uniform transversal load
f = fem.Constant(domain, -1e5)


# Useful function for defining strains and stresses
def curvature(u):
    (w, theta) = ufl.split(u)
    return ufl.as_vector(
        [theta[0].dx(0), theta[1].dx(1), theta[0].dx(1) + theta[1].dx(0)]
    )


def shear_strain(u):
    (w, theta) = ufl.split(u)
    return ufl.grad(w) - theta


def bending_moment(u):
    DD = ufl.as_matrix([[D, nu * D, 0], [nu * D, D, 0], [0, 0, D * (1 - nu) / 2.0]])
    return ufl.dot(DD, curvature(u))


def shear_force(u):
    return F * shear_strain(u)


# Definition of function space for U:displacement, T:rotation
Ue = basix.ufl.element("P", domain.basix_cell(), 2)  # quadratic shape functions
Te = basix.ufl.element("P", domain.basix_cell(), 1, shape=(2,))  # linear shape functions
V = fem.functionspace(domain, basix.ufl.mixed_element([Ue, Te]))

# Functions
u = fem.Function(V, name="Unknown")
u_ = ufl.TestFunction(V)
(w_, theta_) = ufl.split(u_)
du = ufl.TrialFunction(V)

# Linear and bilinear forms
dx = ufl.Measure("dx", domain=domain)
L = f * w_ * dx
a = (
    ufl.dot(bending_moment(u_), curvature(du))
    + ufl.dot(shear_force(u_), shear_strain(du))
) * dx


# Boundary of the plate
# Find all edges of unit square plate
def border(x):
    return np.logical_or(
        np.logical_or(np.isclose(x[0], 0), np.isclose(x[0], 1)),
        np.logical_or(np.isclose(x[1], 0), np.isclose(x[1], 1)),
    )


# fix displacement on the border
facet_dim = 1
sliding_facets = locate_entities_boundary(domain, facet_dim, border)
sliding_dofs = fem.locate_dofs_topological(V.sub(0), facet_dim, sliding_facets)

u0 = fem.Function(V)
bcs = [fem.dirichletbc(u0, sliding_dofs)]

# Solve the problem
problem = fem.petsc.LinearProblem(
    a, L, u=u, bcs=bcs, petsc_options={"ksp_type": "preonly", "pc_type": "lu"}
)
problem.solve()

# Get deflections
w_fun_space, w_idx = V.sub(0).collapse()
w_values = u.x.array[w_idx]

# Get stresses
bending_stress = bending_moment(u) * 6 / thick**2

# Create a function space for stress using a vector element with linear shape functions
V_sigma = fem.functionspace(
    domain,
    basix.ufl.element("Lagrange", basix.CellType.triangle, 1, shape=(3,)),
)
# Define the stress expression
stress_expr = fem.Expression(bending_stress, V_sigma.element.interpolation_points())

# Create the function to store interpolated stresses
stresses = fem.Function(V_sigma)
stresses.interpolate(stress_expr)

# get functionspace and indices of stress corresponding to sigma_x
fs_x, idx_x = V_sigma.sub(0).collapse()

### generate figure with matplotlib
nodes = domain.geometry.x
triangles = domain.geometry.dofmap
stress_x = stresses.x.array[idx_x] / 1e6  # show stress in MPa

# set the colormap
pyplot.set_cmap("jet")
fig, ax = pyplot.subplots()
triangulation = tri_plot.Triangulation(nodes[:, 0], nodes[:, 1], triangles)

levels = np.linspace(min(stress_x), max(stress_x), 16)

contour = ax.tricontourf(
    triangulation,
    stress_x,
    levels=levels,
)

fig.colorbar(contour, ticks=levels)

# show mesh
ax.triplot(
     triangulation, color="black", marker=" ", linestyle="-", linewidth=0.1
 )

ax.axis("equal")
ax.grid(linewidth=1)

pyplot.show()
Thank you for your help


