Hi
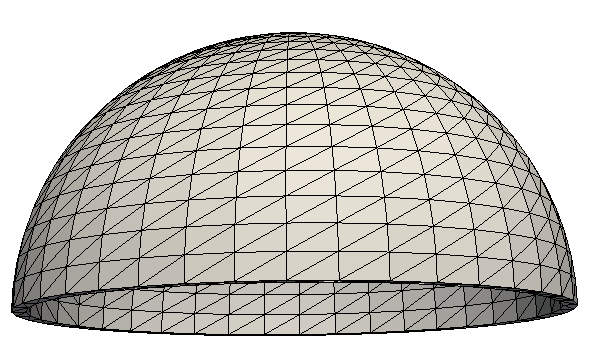
I have a 3D hyperelasticity problem. The domain is a hemisphere with radius 10 mm and thickness 0.5 mm as shown here:
The domain is fixed from the bottom and an internal pressure is applied on the internal surface. In strain energy term, I have an Ei function that I am approximating in the code. In addition I use numerical integration in a part of strain energy term.
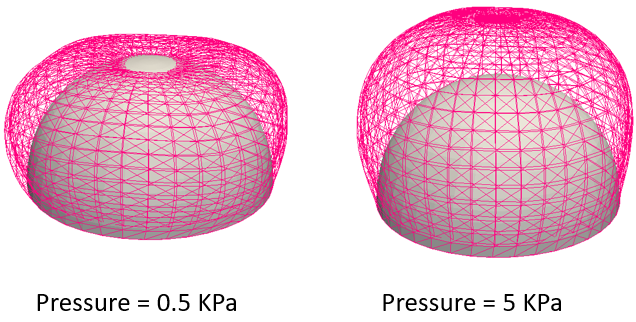
The problem is that the deformation pattern changes when the pressure increases. For example when the internal pressure is 0.5 KPa the deformation is what I expect. When I increase it to 5 KPa, I expect the same deformation pattern but the deformation is completely different and the sphere swells hugely. Please look at this figure showing the deformed and undeformed states for 0.5 KPa and 5 KPa :
Increasing the quadrature degree or number of terms in function approximation or number of intervals in numerical integration were not helpful as I have already tried them.
Does anybody know why this strange behavior happens and might be resolved?
Here is the minimal work (I used GMSH to create the mesh):
from dolfin import *
import numpy as np
parameters["form_compiler"]["representation"] = "tsfc"
mesh = Mesh("mesh.xml")
x = SpatialCoordinate(mesh)
boundaries = MeshFunction("size_t", mesh, "mesh_facet_region.xml")
subdomains = MeshFunction("size_t", mesh, "mesh_physical_region.xml")
dx = Measure('dx', domain=mesh, subdomain_data=subdomains, metadata={'quadrature_degree': 2})
ds = Measure('ds', domain=mesh, subdomain_data=boundaries, metadata={'quadrature_degree': 2})
n = FacetNormal(mesh)
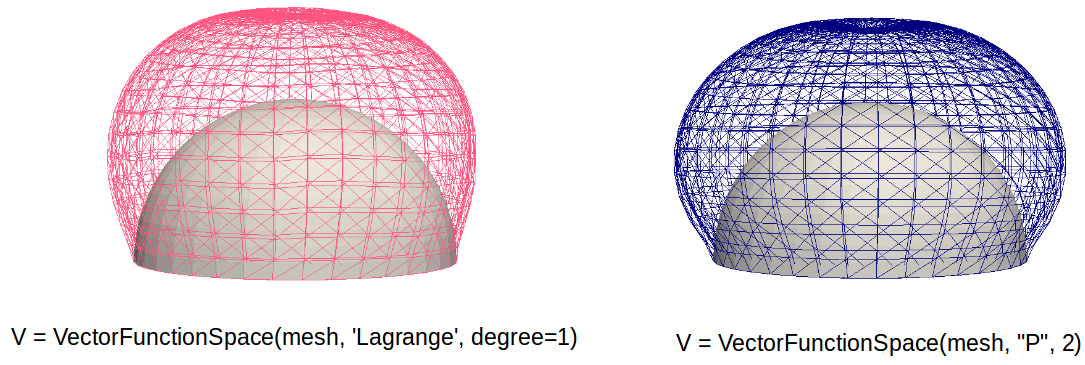
V = VectorFunctionSpace(mesh, 'Lagrange', degree=1)
u = Function(V)
v = TestFunction(V)
I = Identity(3)
F = I + grad(u)
C = F.T*F
Ic = tr(C)
J = det(F)
Ic_bar = pow(J,-2./3.)*Ic
#Numerical Calculation of Integral using trapezoidal rule
def trapezoidal(f, a, b, n):
h = (b - a) / n
s = 0.0
s += f(a)/2.0
for i in range(1, n):
s += f(a + i*h)
s += f(b)/2.0
return s * h
#Constants
a_1 = 100e3
a_3 = 5e3
a_4 = 500
K = 5
BULK = 1e7
# Ei function approximation
def Ei(X, k, b):
LN = ln(X)
for s in range(1, k + 1):
fact = 1
for i in range(1, s + 1):
fact = fact * i
b += (pow(-1., s + 1) * pow(-X, s) / (s * fact))
return LN - b
alpha = atan(x[2]/x[0]) + np.pi/2
def G(theta):
R = ((pow(cos(theta), 2) * C[0, 0] + pow(sin(theta), 2) * C[2, 2] )) ** (0.5)
A_theta = 0.01 * exp(K * cos(2 * (theta - alpha)))
F_R = a_3 * (exp(-a_4) * (Ei(a_4 * R, 50, 0) ) - ln(R) )
return A_theta * F_R
G = trapezoidal(G, alpha - np.pi / 2., alpha + np.pi / 2., 10)
Pressure = Constant((5000.0)) # Deformation is completely different for Pressure = 500 and Pressure = 5000
psi = (a_1 * (Ic_bar - 3.) + G + 0.5 * BULK * pow(ln(J),2)) * dx - inner(-Pressure * n, u) * ds(2) # ds(2) corresponds to the inner surface of the sphere
F_total = derivative(psi, u, v)
bc = DirichletBC(V, Constant((0., 0., 0.)), boundaries, 1) # ds(1) corresponds to the bottom surface of the sphere (FIXED)
J1 = derivative(F_total, u)
problem = NonlinearVariationalProblem(F_total, u, bc, J1)
solver = NonlinearVariationalSolver(problem)
solver.solve()
File("Displacement.pvd") << u